I teach economics.
Sometimes, at the end of the semester, the distribution of grades does not properly capture the class outcomes observed by the instructor. This happens for a variety of reasons. A common question asked by colleagues is “What should I do to correct this?”
In the long run, a course update may be required. But for the class in question, I might use a curve to reshape the distrbution of grades to better reflect the observed outcomes.
Another common question is “How do you curve course grades?” To curve course grades I use a linear scale. I first found this method on the blog Division by Zero while asking myself the same question. There David Richeson presents several methods to curve course grades (some with a pinch of humor).
This presentation of the linear scale method seeks to simplify the calculation and provide greater exposition on the application of the curve.
To apply the curve we generate a function that takes the old score as an input and provides a new “curved” score as the output. The formula below is used to apply a linear scale curve to a set of scores.
The Formula
\[CurvedScore = New_{mean} + \left(\frac{New_{low}-New_{mean}}{Old_{low}-Old_{mean}}\right)(OldScore-Old_{mean})\]
To generate this function we need two points from the original distribution (I use the mean and lowest score) and the values for those points in the new distribution we wish to create. For example: suppose the average grade for a class is 70, the lowest grade is 40, and the desired average and low score are 80 and 60. The formula for this curve would be generated in the following way:
\[CurvedScore = 80 + \left(\frac{60-80}{40-70}\right)(OldScore-70)\]
After simplification:
\[CurvedScore = 80 + \left(\frac{2}{3}\right)(OldScore-70)\]
To complete the process, each score (\(OldScore\)) passes through the function and is assigned a curved value (\(CurvedScore\)). Below is an empirical example to help illustrate how the calculation is made.
Empirical Example
The following empirical example presents the application of a linear curve to a set of scores from a hypothetical class. First, identify the scores for each student as well as the average and lowest score. Scores for students “a” through “q” are presented with the average and lowest score identified below.
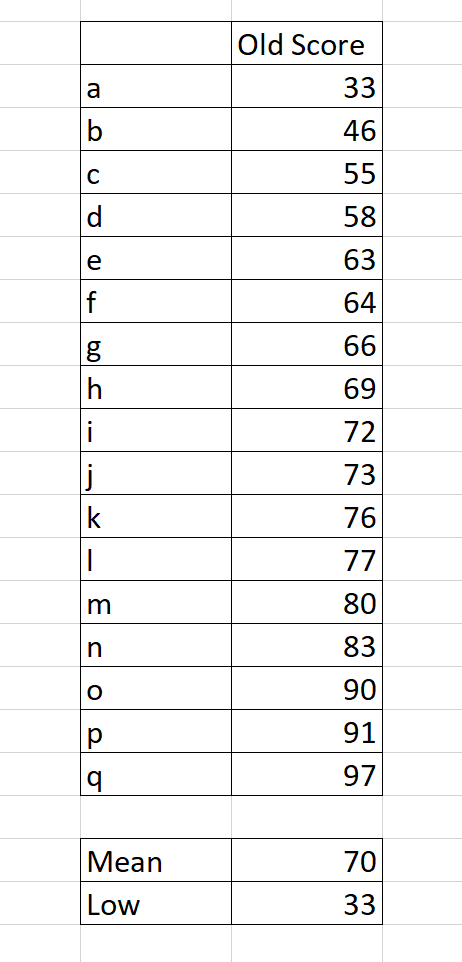
Our hypothetical class has a mean of 70 and a low of 33. Let us suppose we want to curve these grades up to a new mean of 82 and a new low of 55. The next step is to calculate the formula for these desired attributes and apply the formula to each score. Here is the calculation for this example:
\[CurvedScore = 82 + \left(\frac{55-82}{33-70}\right)(OldScore-70)\]
After simplification:
\[CurvedScore = 82 + \left(\frac{27}{37}\right)(OldScore-70)\]
The formula can now be applied to each score. I use spreadsheet software to do the calculation. A template of this exercise is included at the end of this post. Here is the formula used in the spreadsheet:
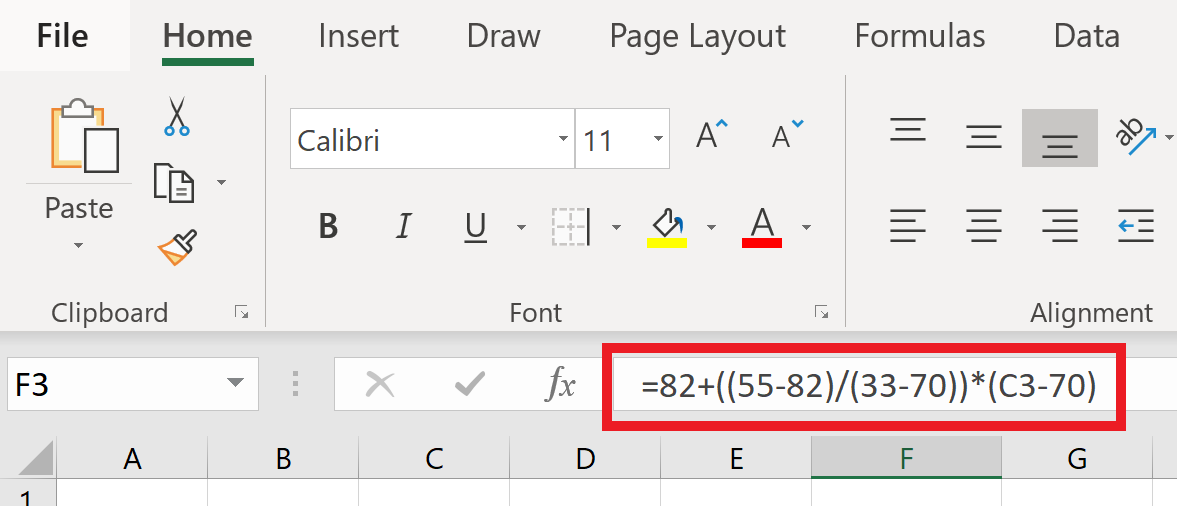
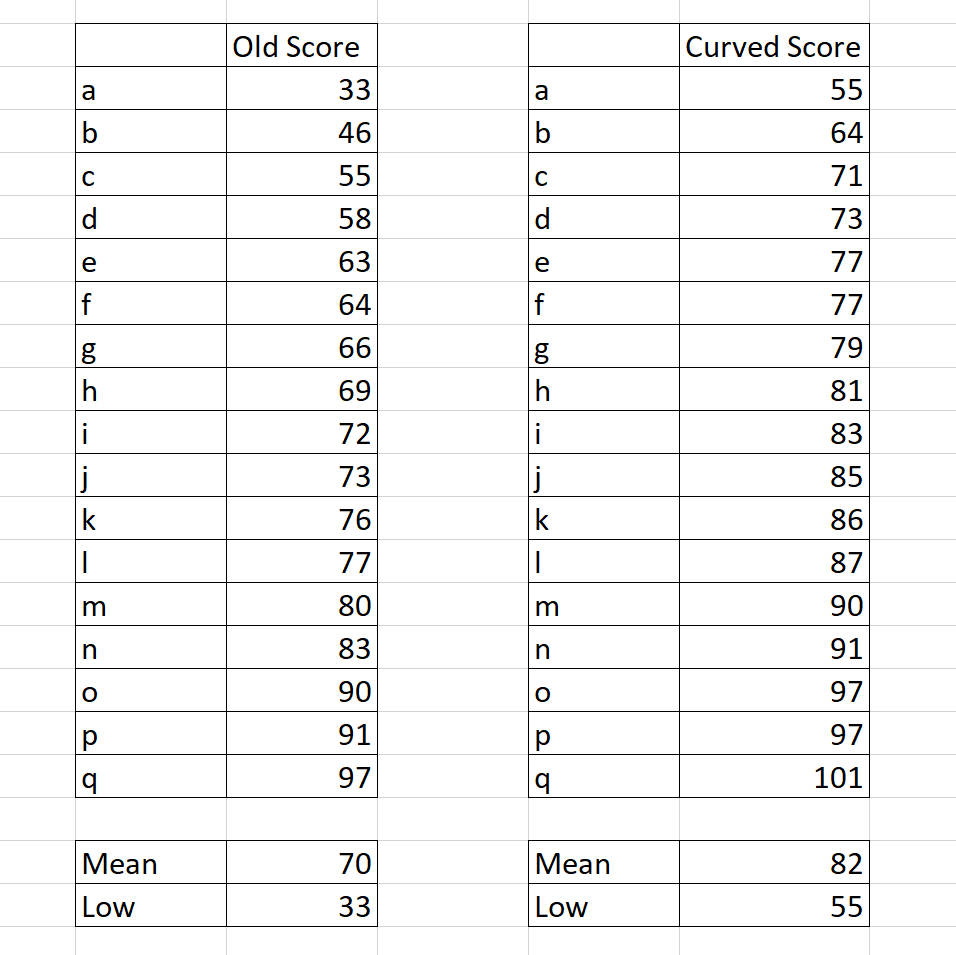
The result is a curved score corresponding to each original score. The set of new scores has the desired average and low score set out in the beginning of the application. Here is the set of old and curved scores:
And that is how to curve class grades with the linear scale method.
Final Thoughts
The linear scale method is presented as an option to curve course grades. It is a relatively straight forward way of applying a curve to grades, but it has some limitations. It does not apply an equal increase to each grade in the distribution, which may be seen as favoring some students over others. Note in the example above, student “a” receives a 22 point (or 66%) increase as the score is curved from 35 to 55. While student “q” receives a 4 point (or 4%) increase curved from 97 to 101.
It is also possible for this method to take points away from higher grades in the distribution to acheive the desired mean and low score. I deal with this problem by simply ignoring the curved score for students with higher original scores (effectively providing no change in their original score due to the curve). As a result, this method may take some trial and error to acheive an appropriate distribution of grades.
The strength of this technique is that it can easily reshape a bimodal distribution into a more uniform distribution of grades and it can target a desired distribution much better than simply adding a flat increase to all scores.
If you want to use the linear scale method to curve your course grades, the spreadsheet template used in this example can be downloaded at this link.